The following document is a brief summary of some successful Trans-Auroral HF digital communications openings as assessed by Pactor-I/II. Between Feb 2002 and March 2004, eight successful connections between North America and SE Asia opposite the auroral ovals were confirmed by a bidirectional exchange of FSK digital callsigns. Four of these data links resulted in propagation time delays consistent with the shortest and most direct paths through the northern auroral oval. The four remaining data links had propagation times well beyond those expected for the northern Trans-Auroral propagation mode. Animated GIFs of the auroral ion currents as determined by the SuperDARN OTH Radar were constructed at the times Trans-Auroral links were observed. These images generally show decreases in the ion currents along the shortest paths connecting the two Pactor stations during the successful callsign exchanges. Side scatter, gray-line, and long-path propagation are believed to have played a role in the four remaining data links. Finally, the OTH research radar data are shown to be a useful tool for propagation predictions in conjunction with the propagation forecasts for the SFI and K-Index levels.
Figure 1 specifically illustrates the movements of high velocity auroral plasma currents during a successful 43 minute long Pactor-II PSK digital link between AE4TM in Nashville, Tennessee and UK8AWY in Tashkent, Uzbekistan on 23-Feb-2002 when the Solar Flux Index was 188. These ion currents were calculated by the collective Doppler data from the northern hemisphere SuperDARN radar network. At one point in this data link, the flow of data ceased (marked with green) and according to the SuperDARN data this corresponded to a sudden drop in ion velocity along the line connecting Tashkent and Nashville just east of Greenland. Such a sudden drop in ion velocity is expected to cause a frequency shift in the digital signal temporarily disrupting the data link. Note that the propagation time delays between Nashville and Tashkent were consistent with the shortest path (6854 statute miles) connecting these two stations and these are the paths that are indicated in this animation.
Figures 2 and 3 above illustrate brief but successful Trans-Auroral digital Pactor-I links between AE4TM in Nashville, Tennessee and UK8AWY in Tashkent on (upper) April 26, 2003 when the Solar Flux Index (SFI) was 144 and (lower) March 3, 2004 when the Solar Flux Index (SFI) was a low 90.4. Both links consisted of bidirectional exchanges of FSK callsigns occurring during sudden changes in the auroral ion velocities along the lines connecting these Pactor stations.
Figure 4 above illustrates a successful brief Trans-Auroral digital Pactor-I link between AE4TM in Nashville, Tennessee and HS0AC in Bangkok, Thailand on July 14, 2003 when the Solar Flux Index (SFI) was 127. Similarly, this link consisted of a bidirectional exchange of FSK callsigns and it also occurred during a drop in the auroral ion velocities along the line connecting these two Pactor stations.
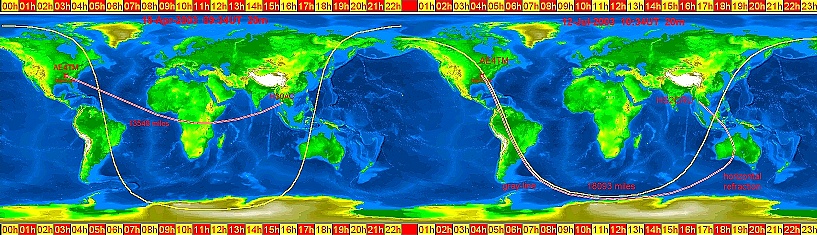
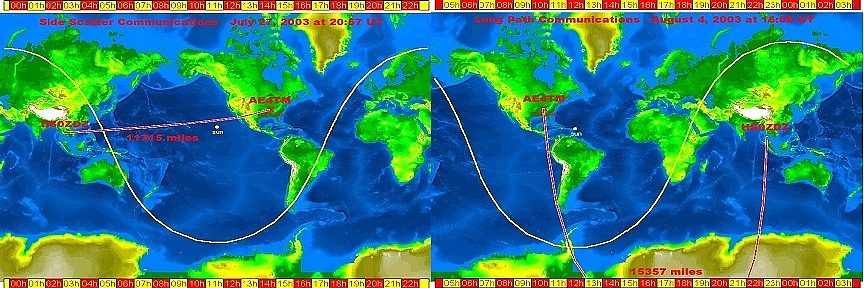
Figure 5 illustrates the four circumstances when the propagation times between Nashville, Tennessee and Bangkok, Thailand were far in excess of the shortest northern Trans-Auroral paths. The upper left panel is believed to represent the most plausible path between AE4TM and HS0AC on April 18, 2003. The propagation delay for this Pactor data link is consistent with a ground path of ~13546 miles. The upper right panel is believed to represent the most plausible path between AE4TM and HS2CRU on July 12, 2003. The propagation delay for this Pactor data link is consistent with a ground path of ~18093 miles. Both links consisted of an exchange of a portion of the station greeting text and the Solar Flux Indices were 108 and 122, respectively. The lower left panel represents the most plausible path between AE4TM and HS0ZDZ on July 27, 2003 when the ground path was measured at ~11315 miles. The lower right panel represents a long path contact at ~15357 miles to HS0ZDZ recorded on August 4, 2003. The Solar Flux Indices for these latter two links were 102 and 123, respectively. These paths were all determined by affixing a string equivalent to the measured ground distances to a globe and later transferring the paths to the world maps shown. On April 18, 2003, the link was believed to be due to a side scatter mechanism somewhere east of Africa which would have been the region of maximum ionization at that time. On July 12, 2003, the link was believed to be due in part to gray-line propagation as well as a side scatter mechanism somewhere near Australia and/or Indonesia. Note that the longer non-Trans-Auroral links occurred at a lower Solar Flux Index than the three Trans-Auroral data links.